
Cloud-Native Application Challenges
Take 35% off Continuous Delivery for Kubernetes by entering fccsalatino into the discount code box at checkout at manning.com.
In some cases, application/service developers need to make sure that they build their services to be resilient and some concerns are solved by Kubernetes or the infrastructure.
This article covers some of the most common challenges associated with Cloud Native applications. I find it useful to know what are the things that are going to go wrong in advance, rather than when I’m already building and delivering the application. This isn’t an extensive list; it’s a beginning to make sure that you don’t get stuck with problems that are widely known. The following sections exemplify and highlight these challenges with the Conference platform.
- Downtime isn’t allowed: If you build and run a Cloud-Native application on top of Kubernetes and you still suffer from application downtime, then you aren’t capitalizing on the advantages of the technology stack that you use.
- Built-in resiliency: downstream services go down and you need to make sure that your services are prepared. Kubernetes helps with dynamic Service Discovery, but this isn’t enough for your application to be resilient.
- Dealing with the application state isn’t trivial: we must understand each service infrastructural requirements to efficiently allow Kubernetes to scale up and down our services.
- Data inconsistent data: a common problem of working with distributed applications is that data isn’t stored in a single place and tends to be distributed. The application needs to be ready to deal with cases where different services have different views of the state of the world.
- Understanding how the application is working (monitoring, tracing and telemetry): having a clear understanding on how the application performs and that it’s doing what it’s supposed to do is important to quickly find problems when things go wrong.
- Application Security and Identity Management: dealing with users and security is always an after-thought. For distributed applications, having these aspects clearly documented and implemented early on helps you to refine the application requirements by defining “who can do what and when”.
Let’s start with the first of the challenges.
Downtime isn’t allowed
As you probably know, you can increase the number of replicas for the API Gateway; this is a great feature when your services are created based on the assumption that they’ll be scaled by the platform by creating new copies of the containers running the service. What happens when the service isn’t ready to handle replication, or when no replicas are available for a given service?
You can also scale the API Gateway to have two replicas running all the time. This means that if one of the replicas stop running for any reason, Kubernetes tries to start another one until two are running.
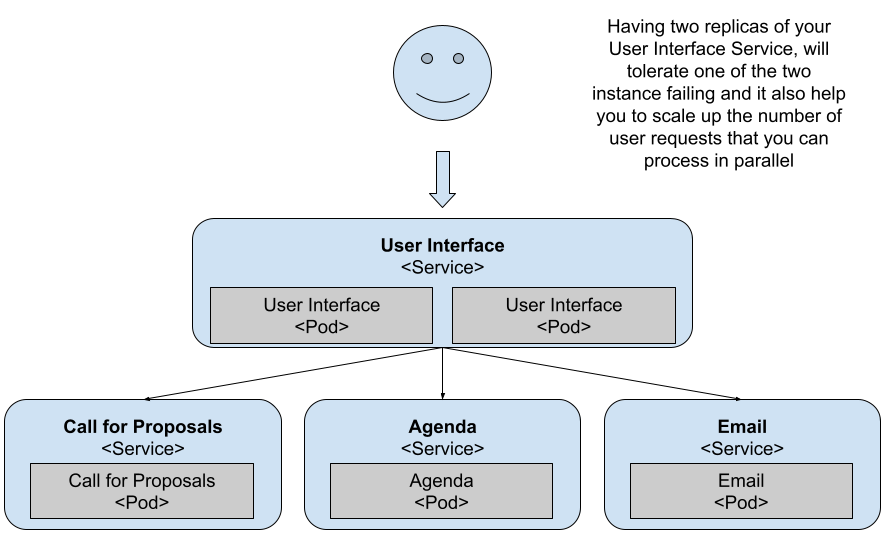
Figure 1 Two replicas for the API Gateway / User Interface
You can quickly try this self-healing feature of Kubernetes by killing one of the two pods of the API Gateway. You can do this by running the following commands:
kubectl get pods
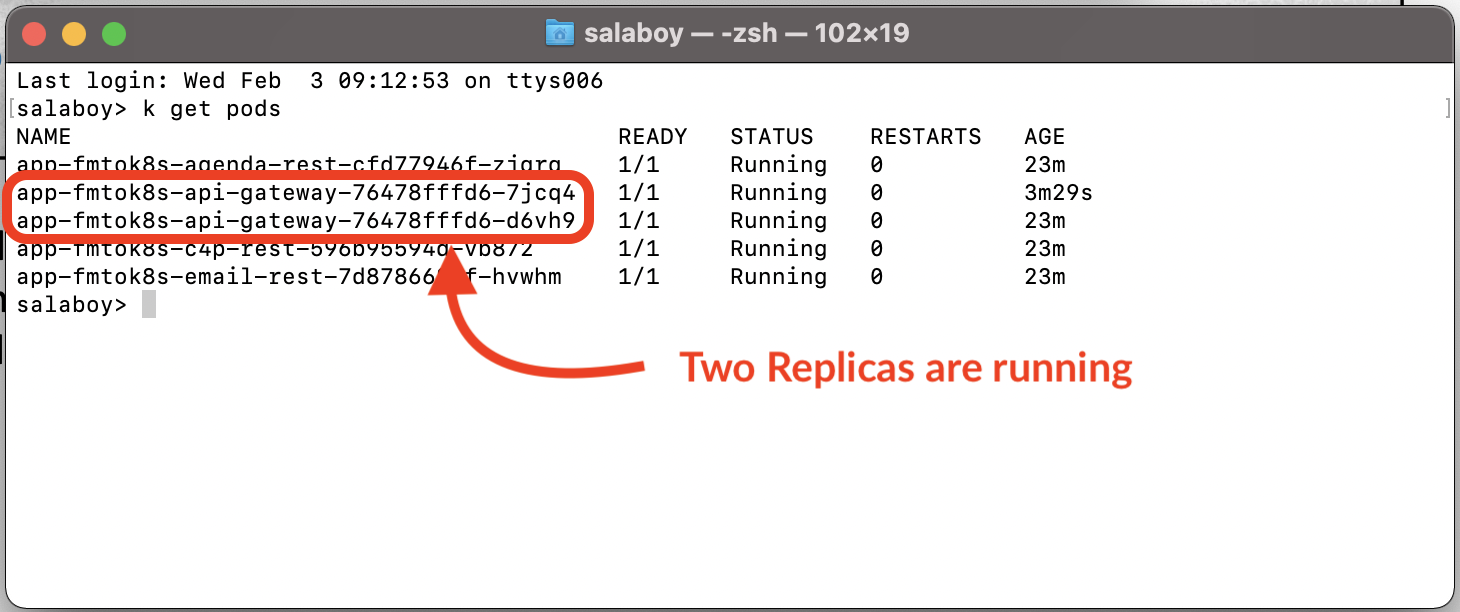
Figure 2 Checking that the two replicas are up and running
Now, copy one of the two Pods Id and delete it:
kubectl delete pod <POD_ID>
Then list the pods again:
kubectl get pods
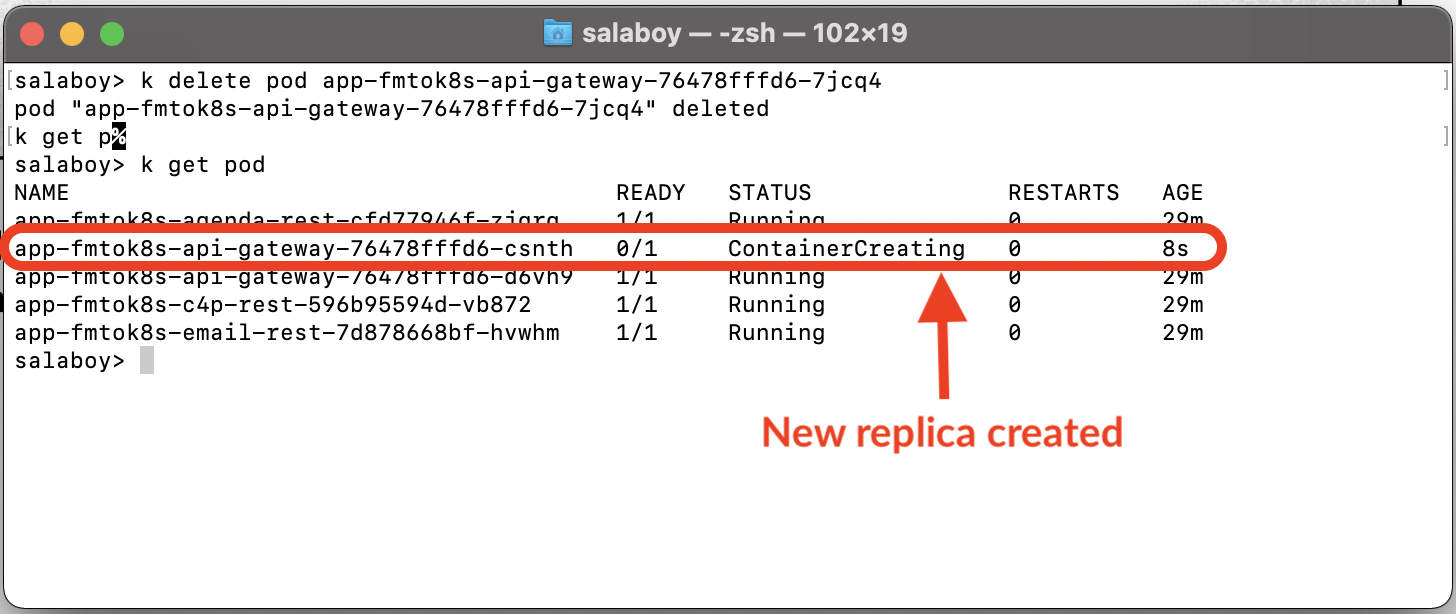
Figure 3 A new replica is automatically created by Kubernetes as soon as one goes down
You can see how Kubernetes (the ReplicaSet more specifically) immediately creates a new pod when it detects that there’s only one running. Although this new pod is being created and started, you’ve a single replica answering your requests until the second one is up and running. This mechanism ensures that there are at least two replicas answering your users’ requests.
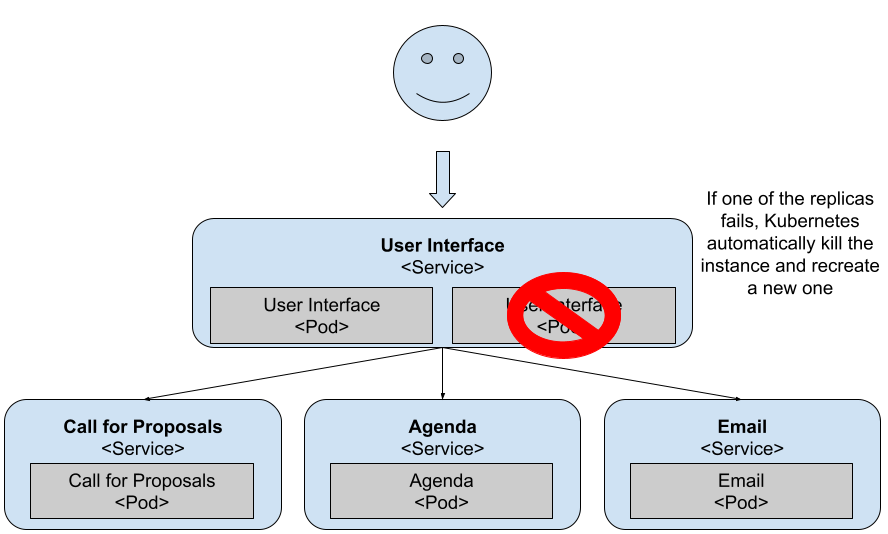
Figure 4 As soon as Kubernetes detects one pod misbehaving it will kill it and create a new one
If you have a single replica or if you kill the running pod, you get downtime in your application until the new container is created and ready to serve requests. You can revert back to a single replica with:
kubectl scale --replicas=1 deployments/<DEPLOYMENT_ID>
Go ahead and try this out, delete only replica available for the API Gateway Pod:
kubectl delete pod <POD_ID>
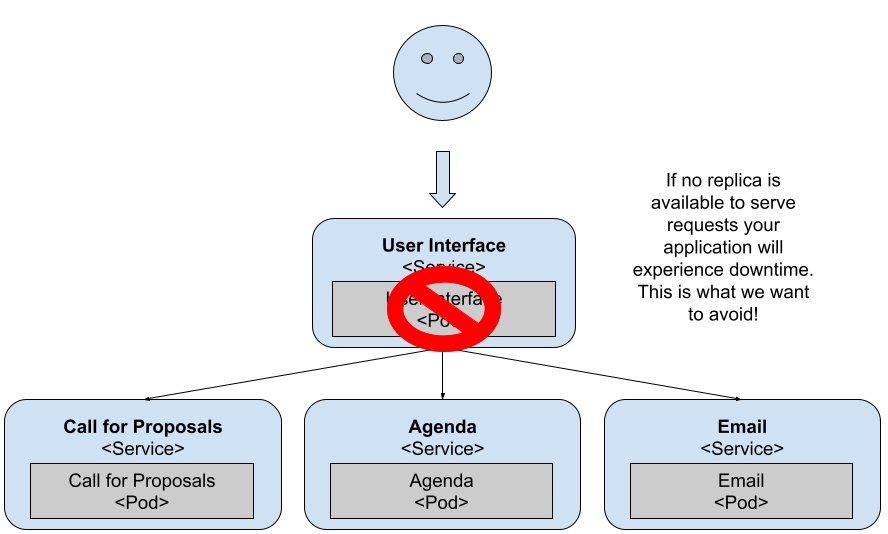
Figure 5 With a single replica being restarted, there’s no backup to answer user requests
Right after killing the pod, try to access the application by refreshing your browser (http://localhost). You should see “503 Service Temporarily Unavailable” in your browser, as the Ingress Controller (not shown in the previous figure for simplicity) can’t find a replica running behind the API Gateway service. If you wait for a bit, you’ll see the application come back up.
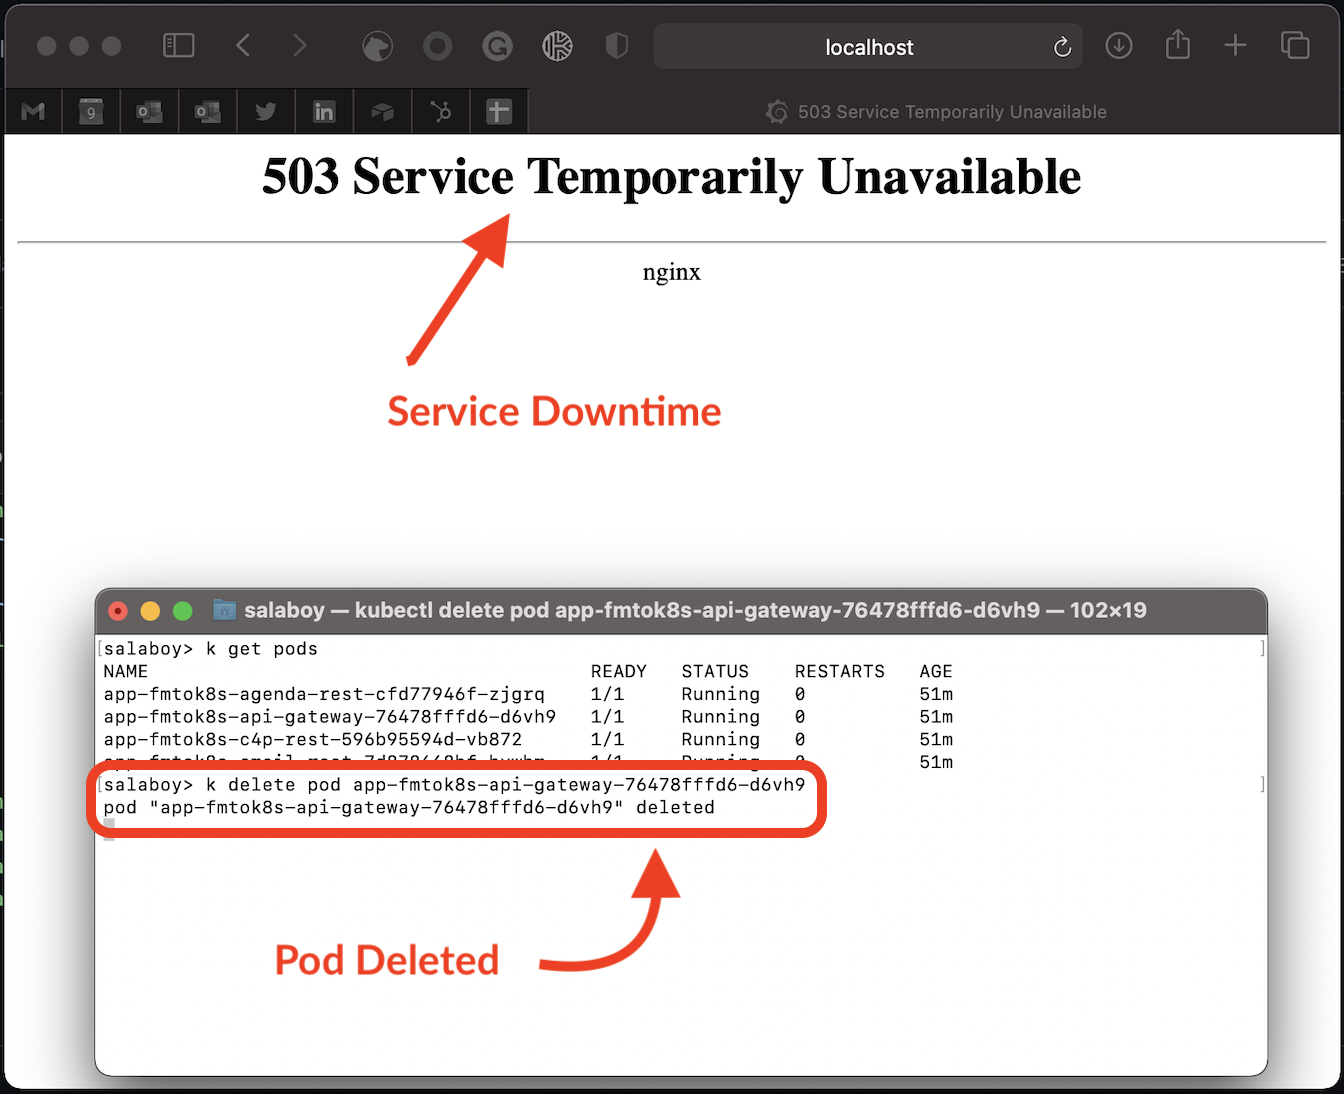
Figure 6 With a single replica being restarted, there’s no backup to answer user requests
This behaviour is to be expected, as the API Gateway Service is a user-facing service. If it goes down, users can’t access any functionality, hence having multiple replicas is recommended. From this perspective, we can assert that the API Gateway / FrontEnd service is the most important service of the entire application as our primary goal for our applications is to avoid downtime.
In summary, pay special attention to user-facing services exposed outside of your cluster. No matter if they’re User Interfaces or APIs, make sure that you’ve as many replicas as needed to deal with incoming requests. Having a single replica should be avoided for most use cases besides development.
Built-in service resiliency
What happens if the other services go down? For example, the Agenda Service, which is in charge of listing all the accepted proposals to the conference attendees.
This service is also critical, as the Agenda List is right there on the main page of the application. Let’s scale the service down:
kubectl scale --replicas=0 deployments/app-fmtok8s-agenda-rest
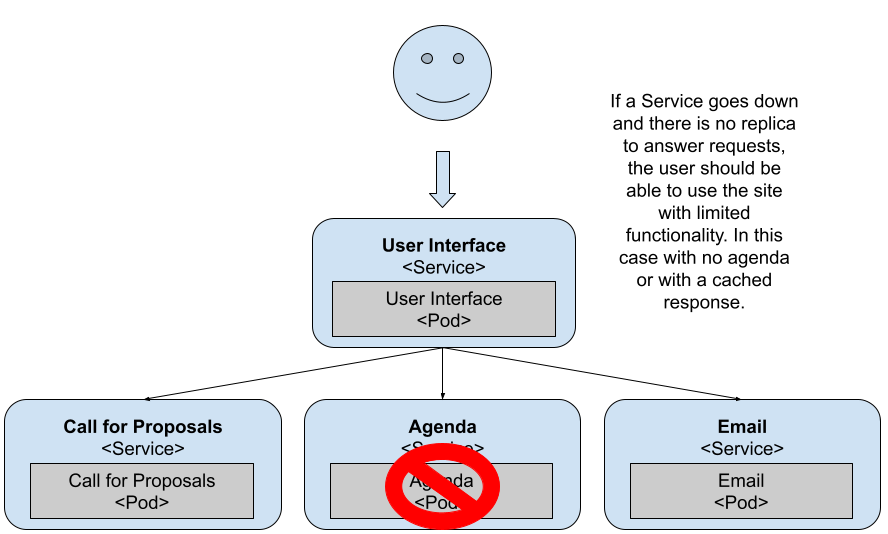
Figure 7 No pods for the Agenda Service
Right after running this command, the container is killed and the service won’t have any container answering its requests.
Try refreshing the application in your browser:
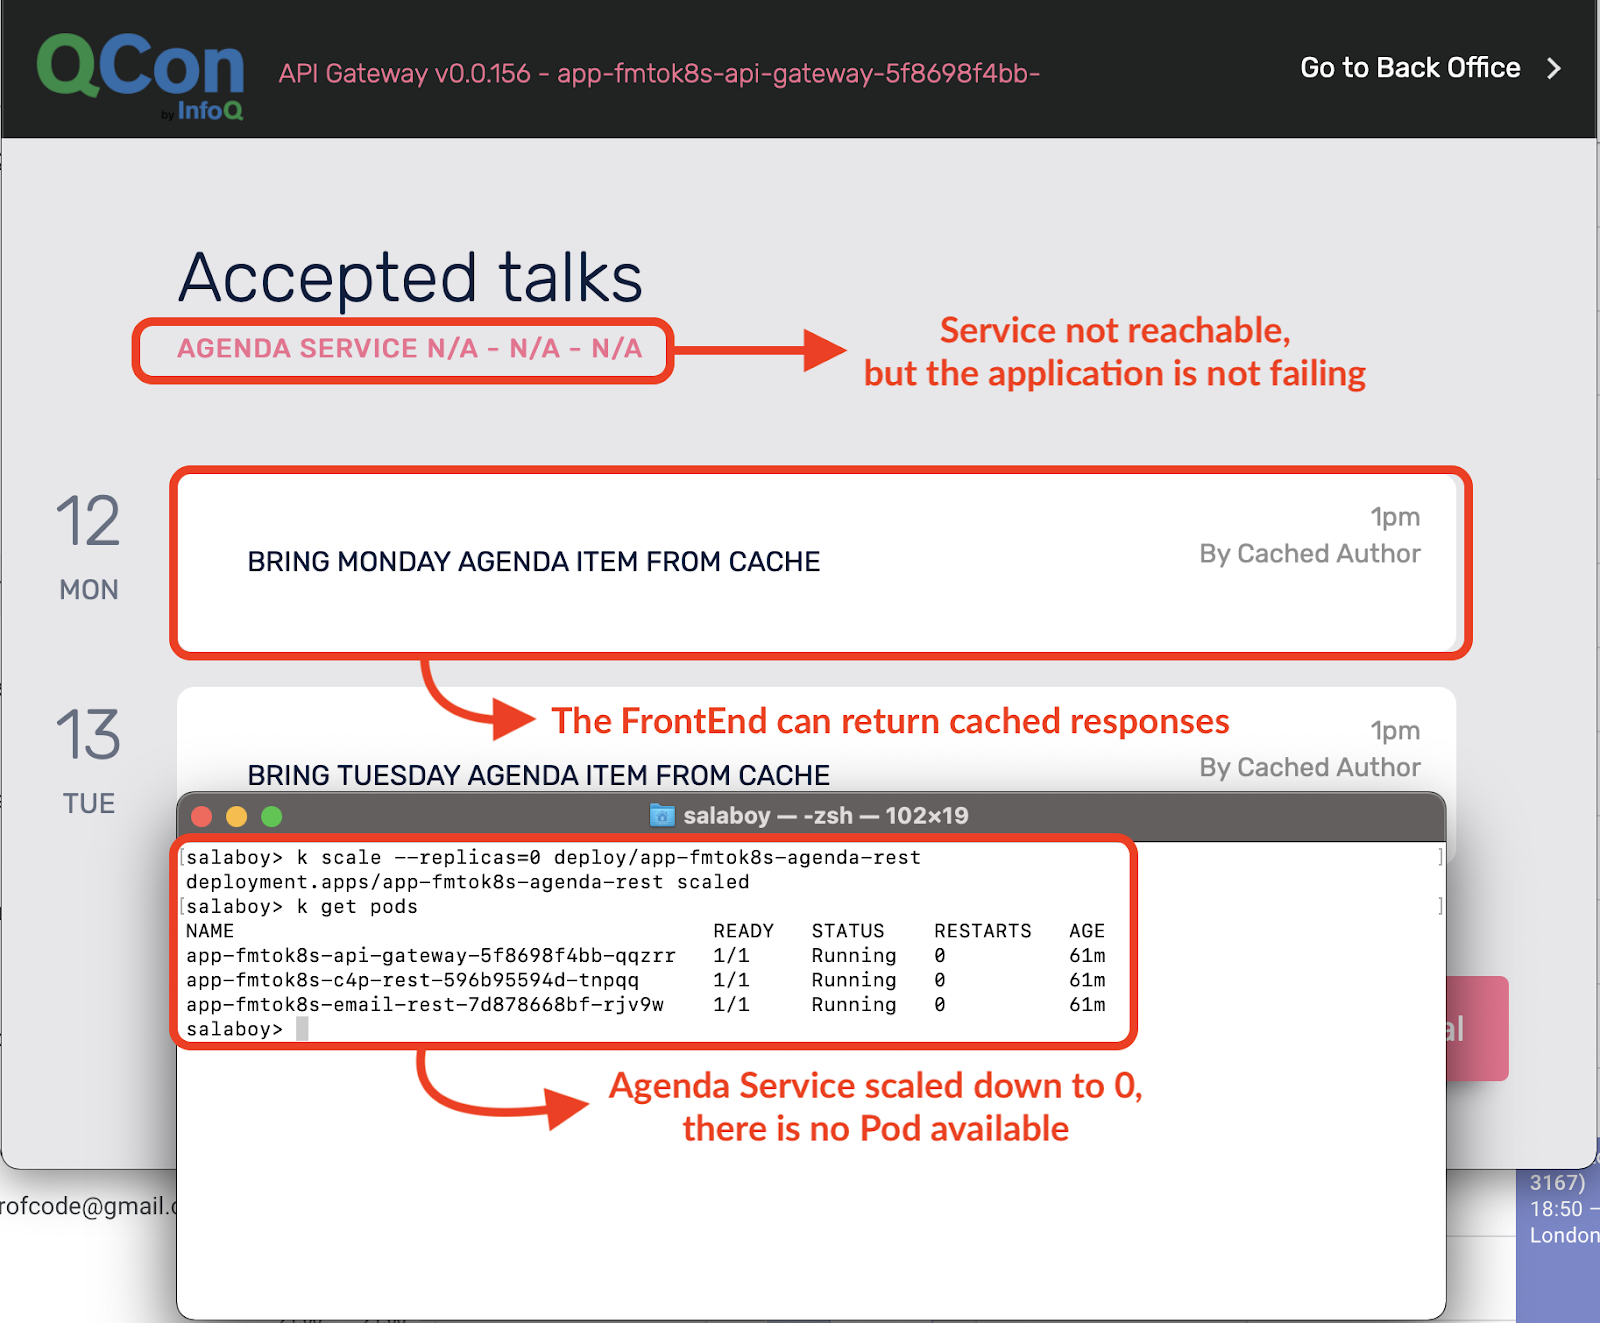
Figure 8 With a single replica being restarted, there’s no backup to answer user requests
As you can see, the application’s still running, but the Agenda Service isn’t available right now. You can prepare your application for such scenarios; in this case, the API Gateway has a cached response to at least show something to the user. If for some reason the Agenda Service is down, at least the user can access other services and other sections of the application. From the application perspective, it’s important to not propagate the error back to the user. The user should be able to keep using other services of the application until the Agenda Service is restored.
You need to pay special attention when developing services that run in Kubernetes as now your service is responsible for dealing with errors generated by downstream services. This is important to make sure that errors or services going down doesn’t bring your entire application down. Having simple mechanisms as cached responses makes your applications more resilient and it l also allows you to incrementally upgrade these services without worrying about bringing everything down. Remember, downtime isn’t allowed.
Dealing with application state isn’t trivial
Let’s scale it up back again to have a single replica:
kubectl scale --replicas=1 deployments/app-fmtok8s-agenda-rest
Let’s create some proposals that populates the Agenda with data. You can do that by running the following command from the terminal:
curl -X POST http://localhost/api/test
This command creates some mock proposals, which you need to accept/reject in the Back Office section of the application. Go ahead and accept all of them.
You should now see all the proposals in the Agenda on the main page.
Now, what do you think happens if we scale the Agenda Service up to two replicas?
kubectl scale --replicas=2 deployments/app-fmtok8s-agenda-rest
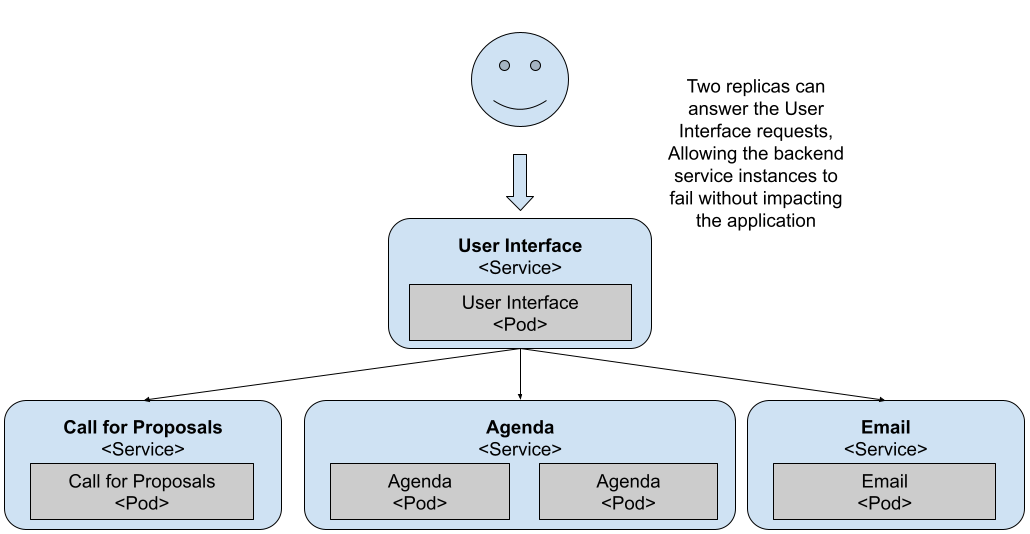
Figure 9 Two replicas can now deal with more traffic
With two replicas dealing with your user requests, now the User Interface has two instances to query. If you try refreshing the application multiple times, you’ll notice that sometimes the agenda page comes back empty.
This is because the Agenda Service keeps the Agenda Items in-memory and each Pod has a separate memory space. All your services should be stateless, meaning that you should store state in some kind of storage that can keep the state no matter which Pod tries to access it. Databases are commonly used for externalizing the state out of your services, allowing your services to be scaled independently.
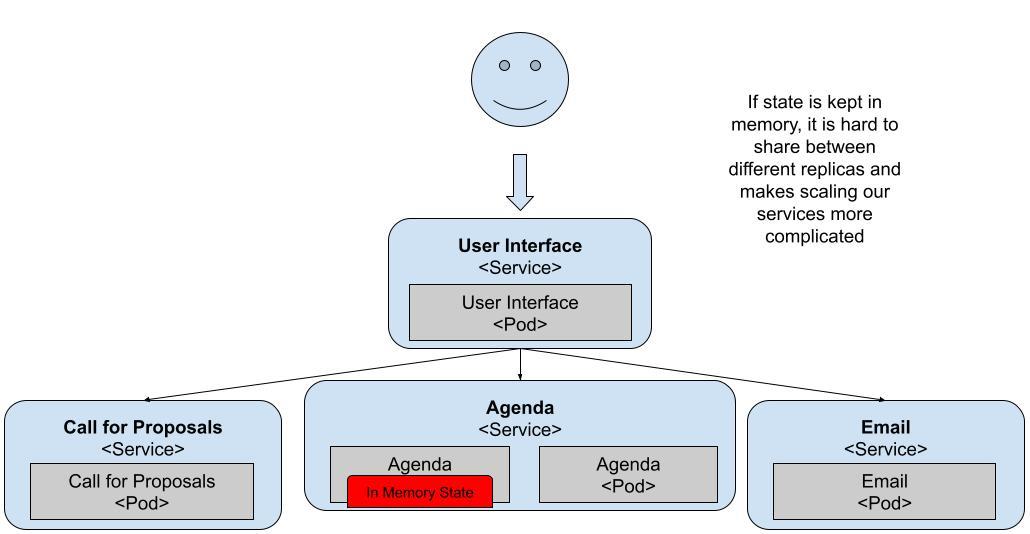
Figure 10 The Agenda Service is keeping state in-memory
By scaling these services up, we find an issue with the design of one of the application services. The Agenda Service keeps state in-memory and that affects the scaling capabilities from Kubernetes. Luckily for us, we can solve this by adding persistent storage.
For the previous services to keep the data, we can install Redis and PostgreSQL to back the data for the Agenda and Call for Proposals service. In the same way that we installed the Conference Platform with Helm we can install Redis and PostgreSQL inside our cluster with Helm.
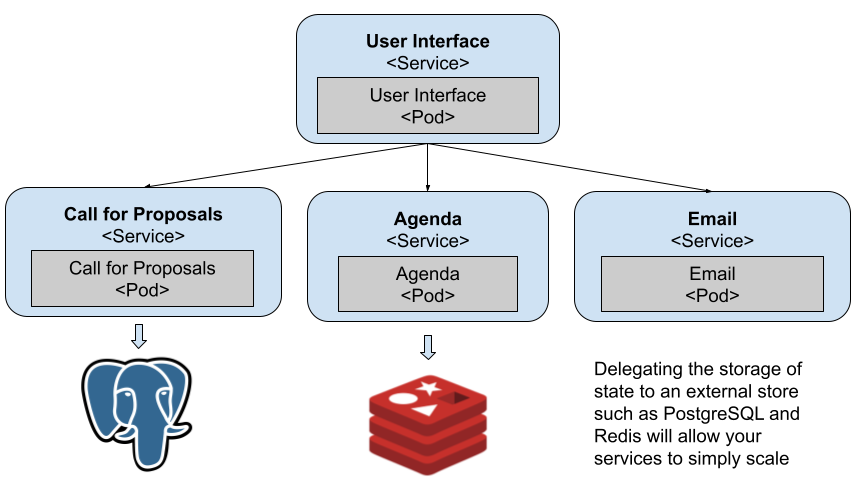
Figure 11 Both data sensitive services use persistent stores
Understanding your service requirements helps you to plan and automate your infrastructural requirements such as Databases, message brokers, etc. The larger and more complex the application gets the more dependencies on these infrastructural components it has.
Dealing with inconsistent data
Having stored data into a relational data store like PostgreSQL or a NoSQL approach like Redis doesn’t solve the problem of having inconsistent data across different stores. As these stores should be hidden away by the service API, you need to have mechanisms to check that the data that the services handle is consistent. In distributed systems it’s quite common to talk about “eventual consistency”, meaning that eventually, the system will be consistent. Having eventual consistency is definitely better than not having consistency at all. For this example, one thing that we can build is a simple check mechanism that sometimes (imagine once a day) checks for the accepted talks in the Agenda Service to see if they have been approved in the Call for Proposal Service. If there’s an entry that hasn’t been approved by the Call for Proposal Service (C4P), then we can raise some alerts or send an email to the conference organizers.
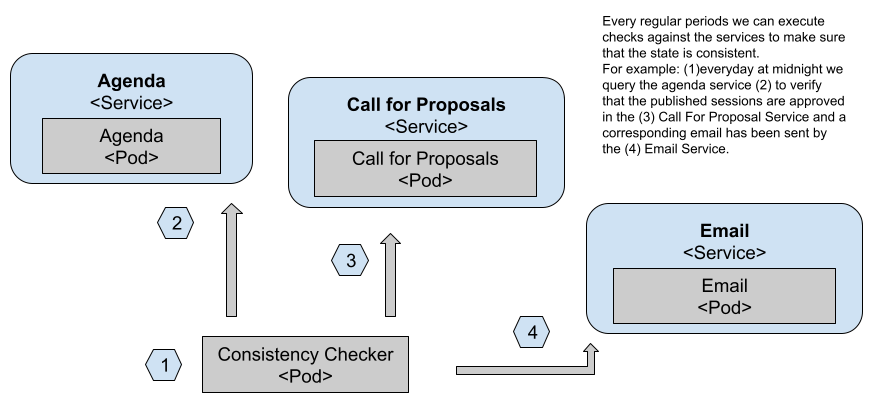
Figure 12 Consistency checks can run as CronJobs
In figure 12 we can see how a CronJob (1) is executed every X period of time, depending on how important it is for us to fix consistency issues. Then it proceeds to query the Agenda Service public APIs (2) to check which accepted proposals are being listed and compare that with the Call for Proposals Service approved list (3). Finally, if any inconsistency is found, an email can be sent using the Email Service public APIs (4).
Think of the simple use case that this application was designed for, what other checks do you need? One that immediately comes to my mind is to verify that emails are sent correctly for Rejection and Approved proposals. For this use case, emails are important and we need to make sure that those emails are sent.
Understanding how the application is working
Distributed systems are complex beasts and fully understanding how they work from day one can help you to save time down the line when things go wrong. This has pushed the monitoring, tracing and telemetry communities to come up with solutions that help us to understand how things are working at any given time.
The https://opentelemetry.io/ OpenTelemetry community has evolved alongside Kubernetes and it can now provide most of the tools that you need to monitor how your services work. As stated on their website: “You can use it to instrument, generate, collect, and export telemetry data (metrics, logs, and traces) for analysis in order to understand your software's performance and behavior.” It’s important to notice that OpenTelemetry focuses on both the behavior and performance of your software as they both impact your users and user experience.
From the behavior point of view, you want to make sure that the application does what it’s supposed to do and by that, you need to understand which services call which other services or infrastructure to perform tasks.
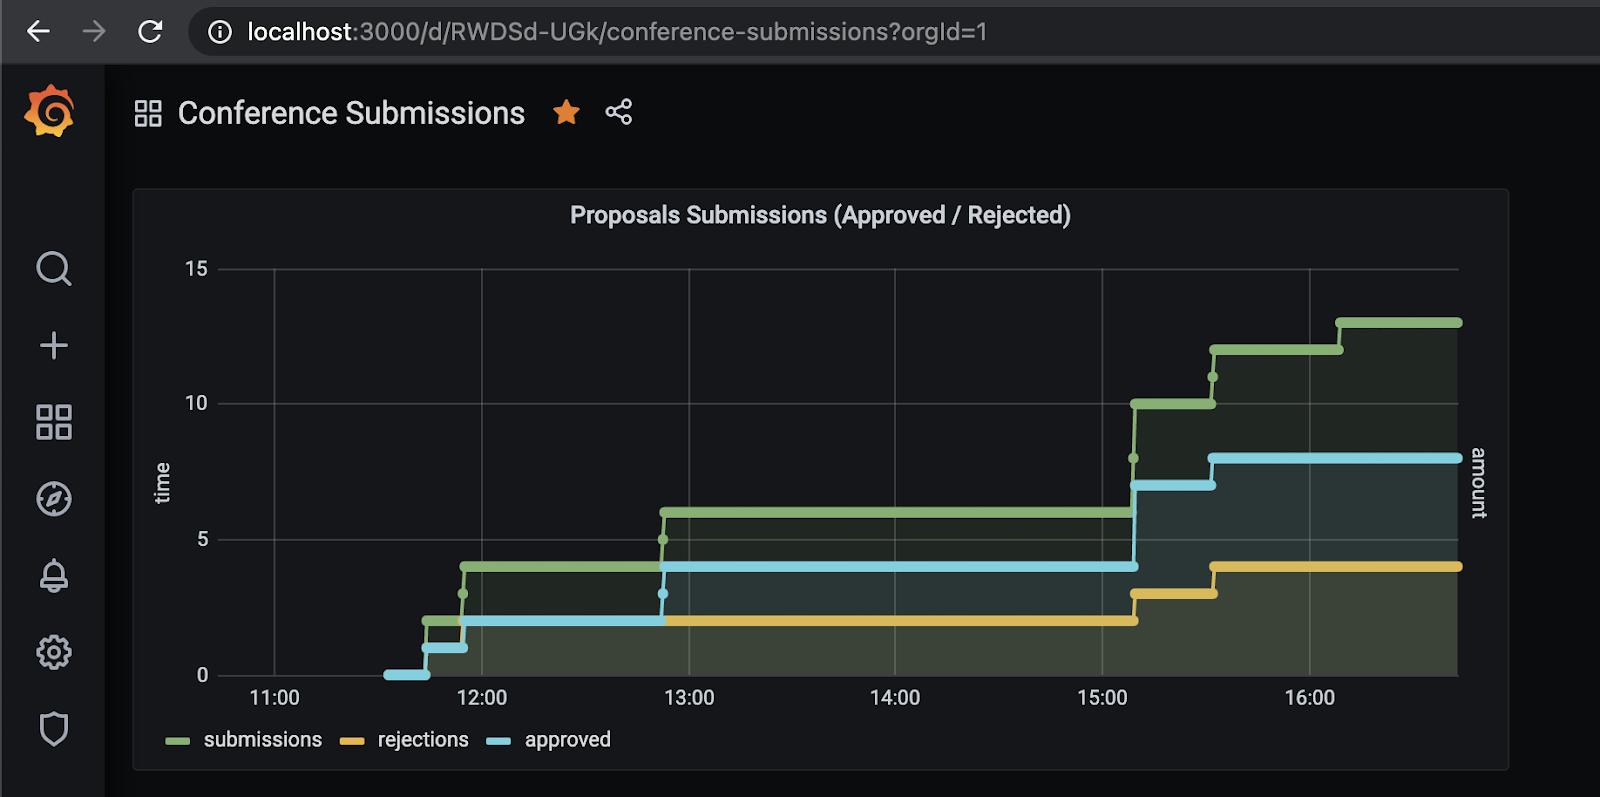
Figure 13 Monitoring telemetry data with Prometheus & Grafana
Using Prometheus and Grafana allows us to not only see the service telemetry, but also build domain specific dashboards to highlight certain application-level metrics, for example the amount of Approved vs Rejected proposals over time as shown in figure 13.
From the performance point of view, you need to make sure that services respect their Service Level Agreements (SLAs) which means that they don’t take too long to answer requests. If one of your services is misbehaving and takes more than usual, you want to be aware of that.
For tracing, you need to modify your services if you’re interested in understanding the internal operations and their performance. OpenTelemetry provides drop-in instrumentation libraries in most languages to externalize service metrics and traces.
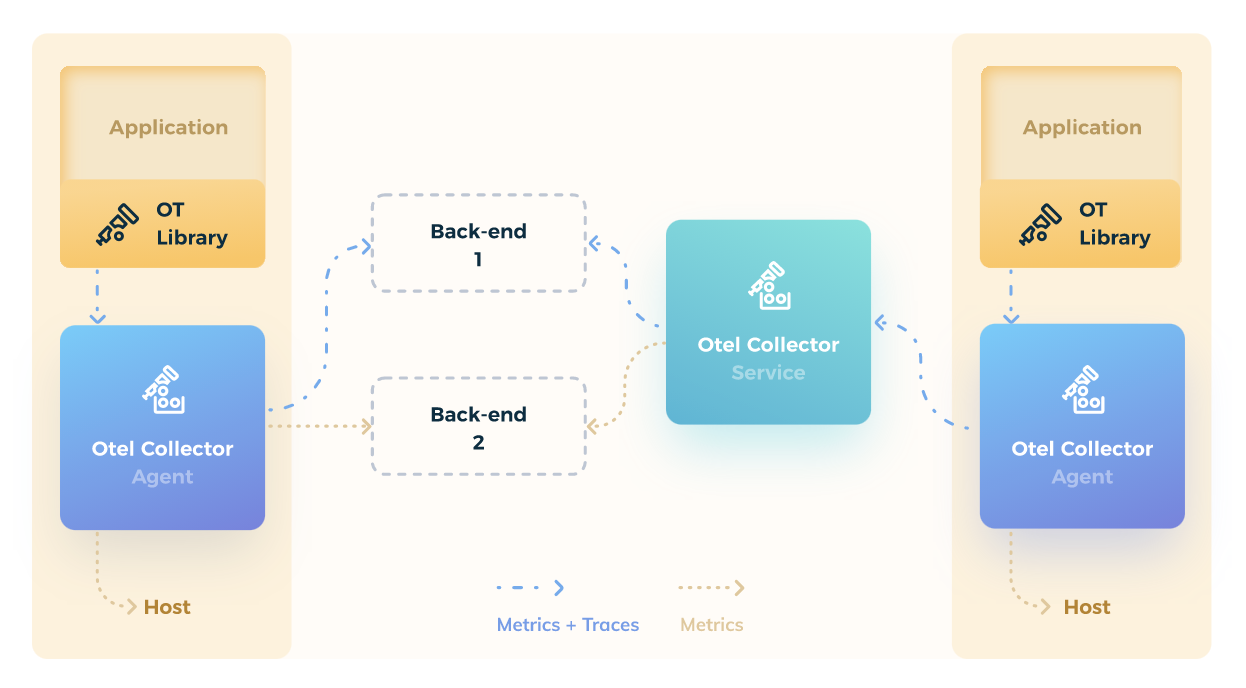
Figure 14 OpenTelemetry architecture and library
Once the instrumentation libraries are included in our services, we can check the traces with tools like Jaeger:
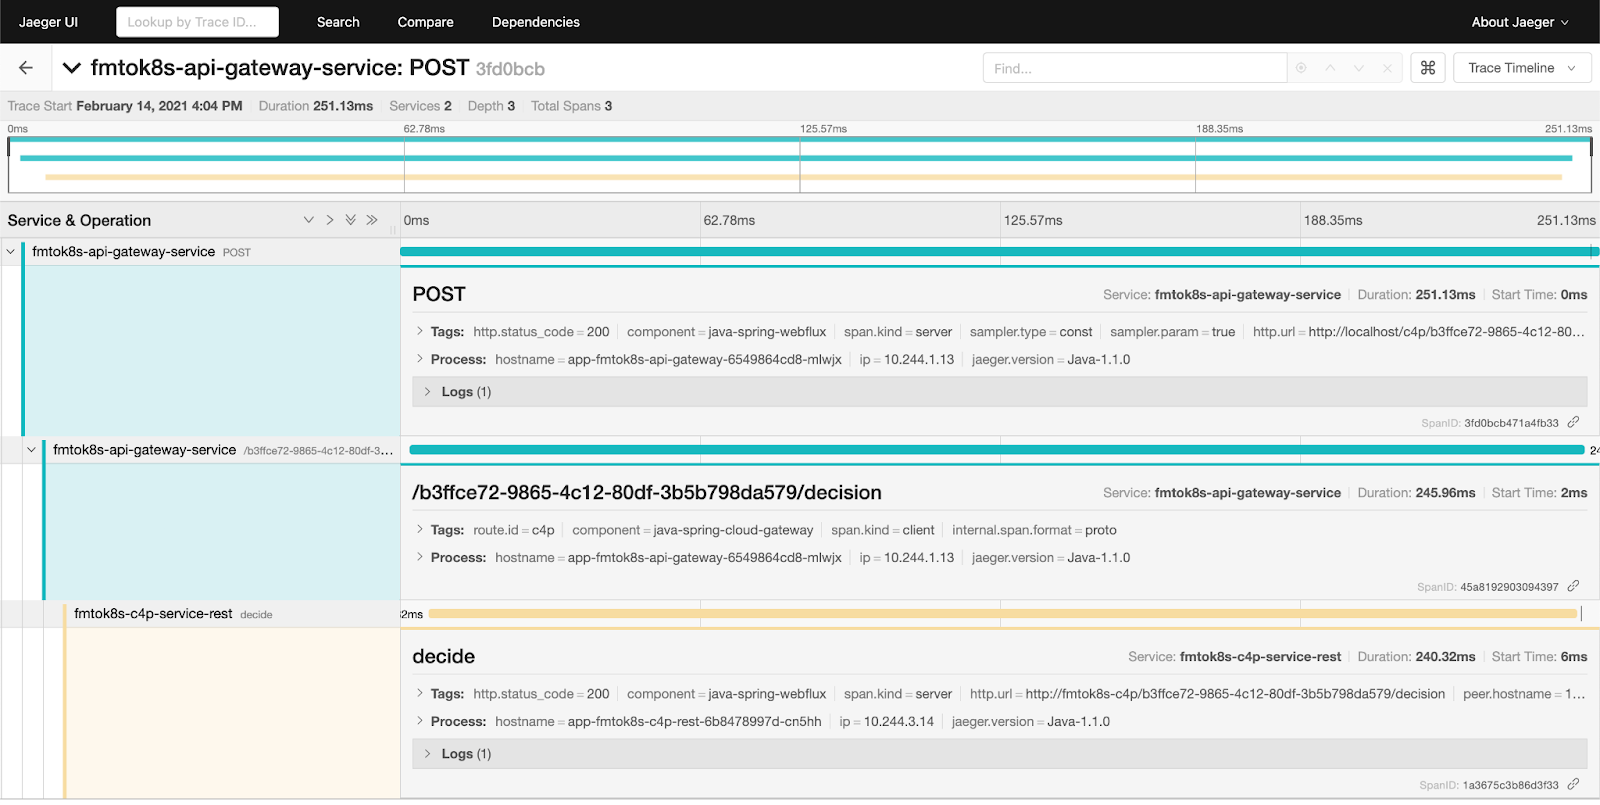
Figure 15 Tracing diagram from Jaeger
You can see in the previous figure, the amount of time used by each service as you process a single user-request.
The recommendation here is that if you create a walking skeleton, make sure that it has OpenTelemetry built-in. If you push monitoring to later stages of the project it’ll be too late, things will go wrong and finding out who is responsible takes too much time.
Application security and identity management
If you ever built a Web application you know that providing identity management (user accounts and user identity) plus Authentication and Authorization is quite an endeavor. A simple way to break any application (cloud-native or not) is to perform actions that you aren’t supposed to do, such as deleting all the proposed presentations unless you’re a conference organizer.
In distributed systems, this becomes challenging as well, as authorization and the user identity needs to be propagated across different services. In distributed architectures, it’s quite common to have a component that generates requests on behalf of a user instead of exposing all the services for the user to interact directly. In our example, the API Gateway is this component. Most of the time you can use this external-facing component as the barrier between external and internal services. For this reason, it’s common to configure the API Gateway to connect with an Authorization & Authentication provider commonly using the OAuth2 protocol.
On the Identity Management front, you’ve seen that the application itself doesn’t handle users or their data and this is a good thing for regulations such as GDPR. We might want to allow users to use their social media accounts to login into our applications without the need for them to create a separate account. This is usually known as social logic.
A popular solution that brings both OAuth2 and Identity Management is Keycloak. An Open-Source project created by Red Hat/JBoss which provides a one-stop-shop for Single Sign-On solution and advanced Identity Management. Alternatively, you can always use the Identity Management provided by your Cloud Provider.
Same as with Tracing and Monitoring, if you plan to have users (and you probably will, sooner or later) including Single Sign-On and identity management into the walking skeleton will push you to think the specifics of “who will be able to do what”, refining your use case even more.
That’s all for this article. If you want to learn more, check it out on Manning’s liveBook platform here.